System Design (Fig 2.0)
Enhanced architecture diagram with zoom and interpretation notes.
Accordions
Charts (SVG)
Icons
Enhanced images
Storyboard animation
CSS-onlyA quick animated narrative of the telemetry pipeline (no JS required).
System Design Diagram (Fig 2.0)
Enhanced imageEnhanced, color-coded SVG (preferred for readability). Expand the original image below if needed.
🖼️View original diagram (image)Click to zoom
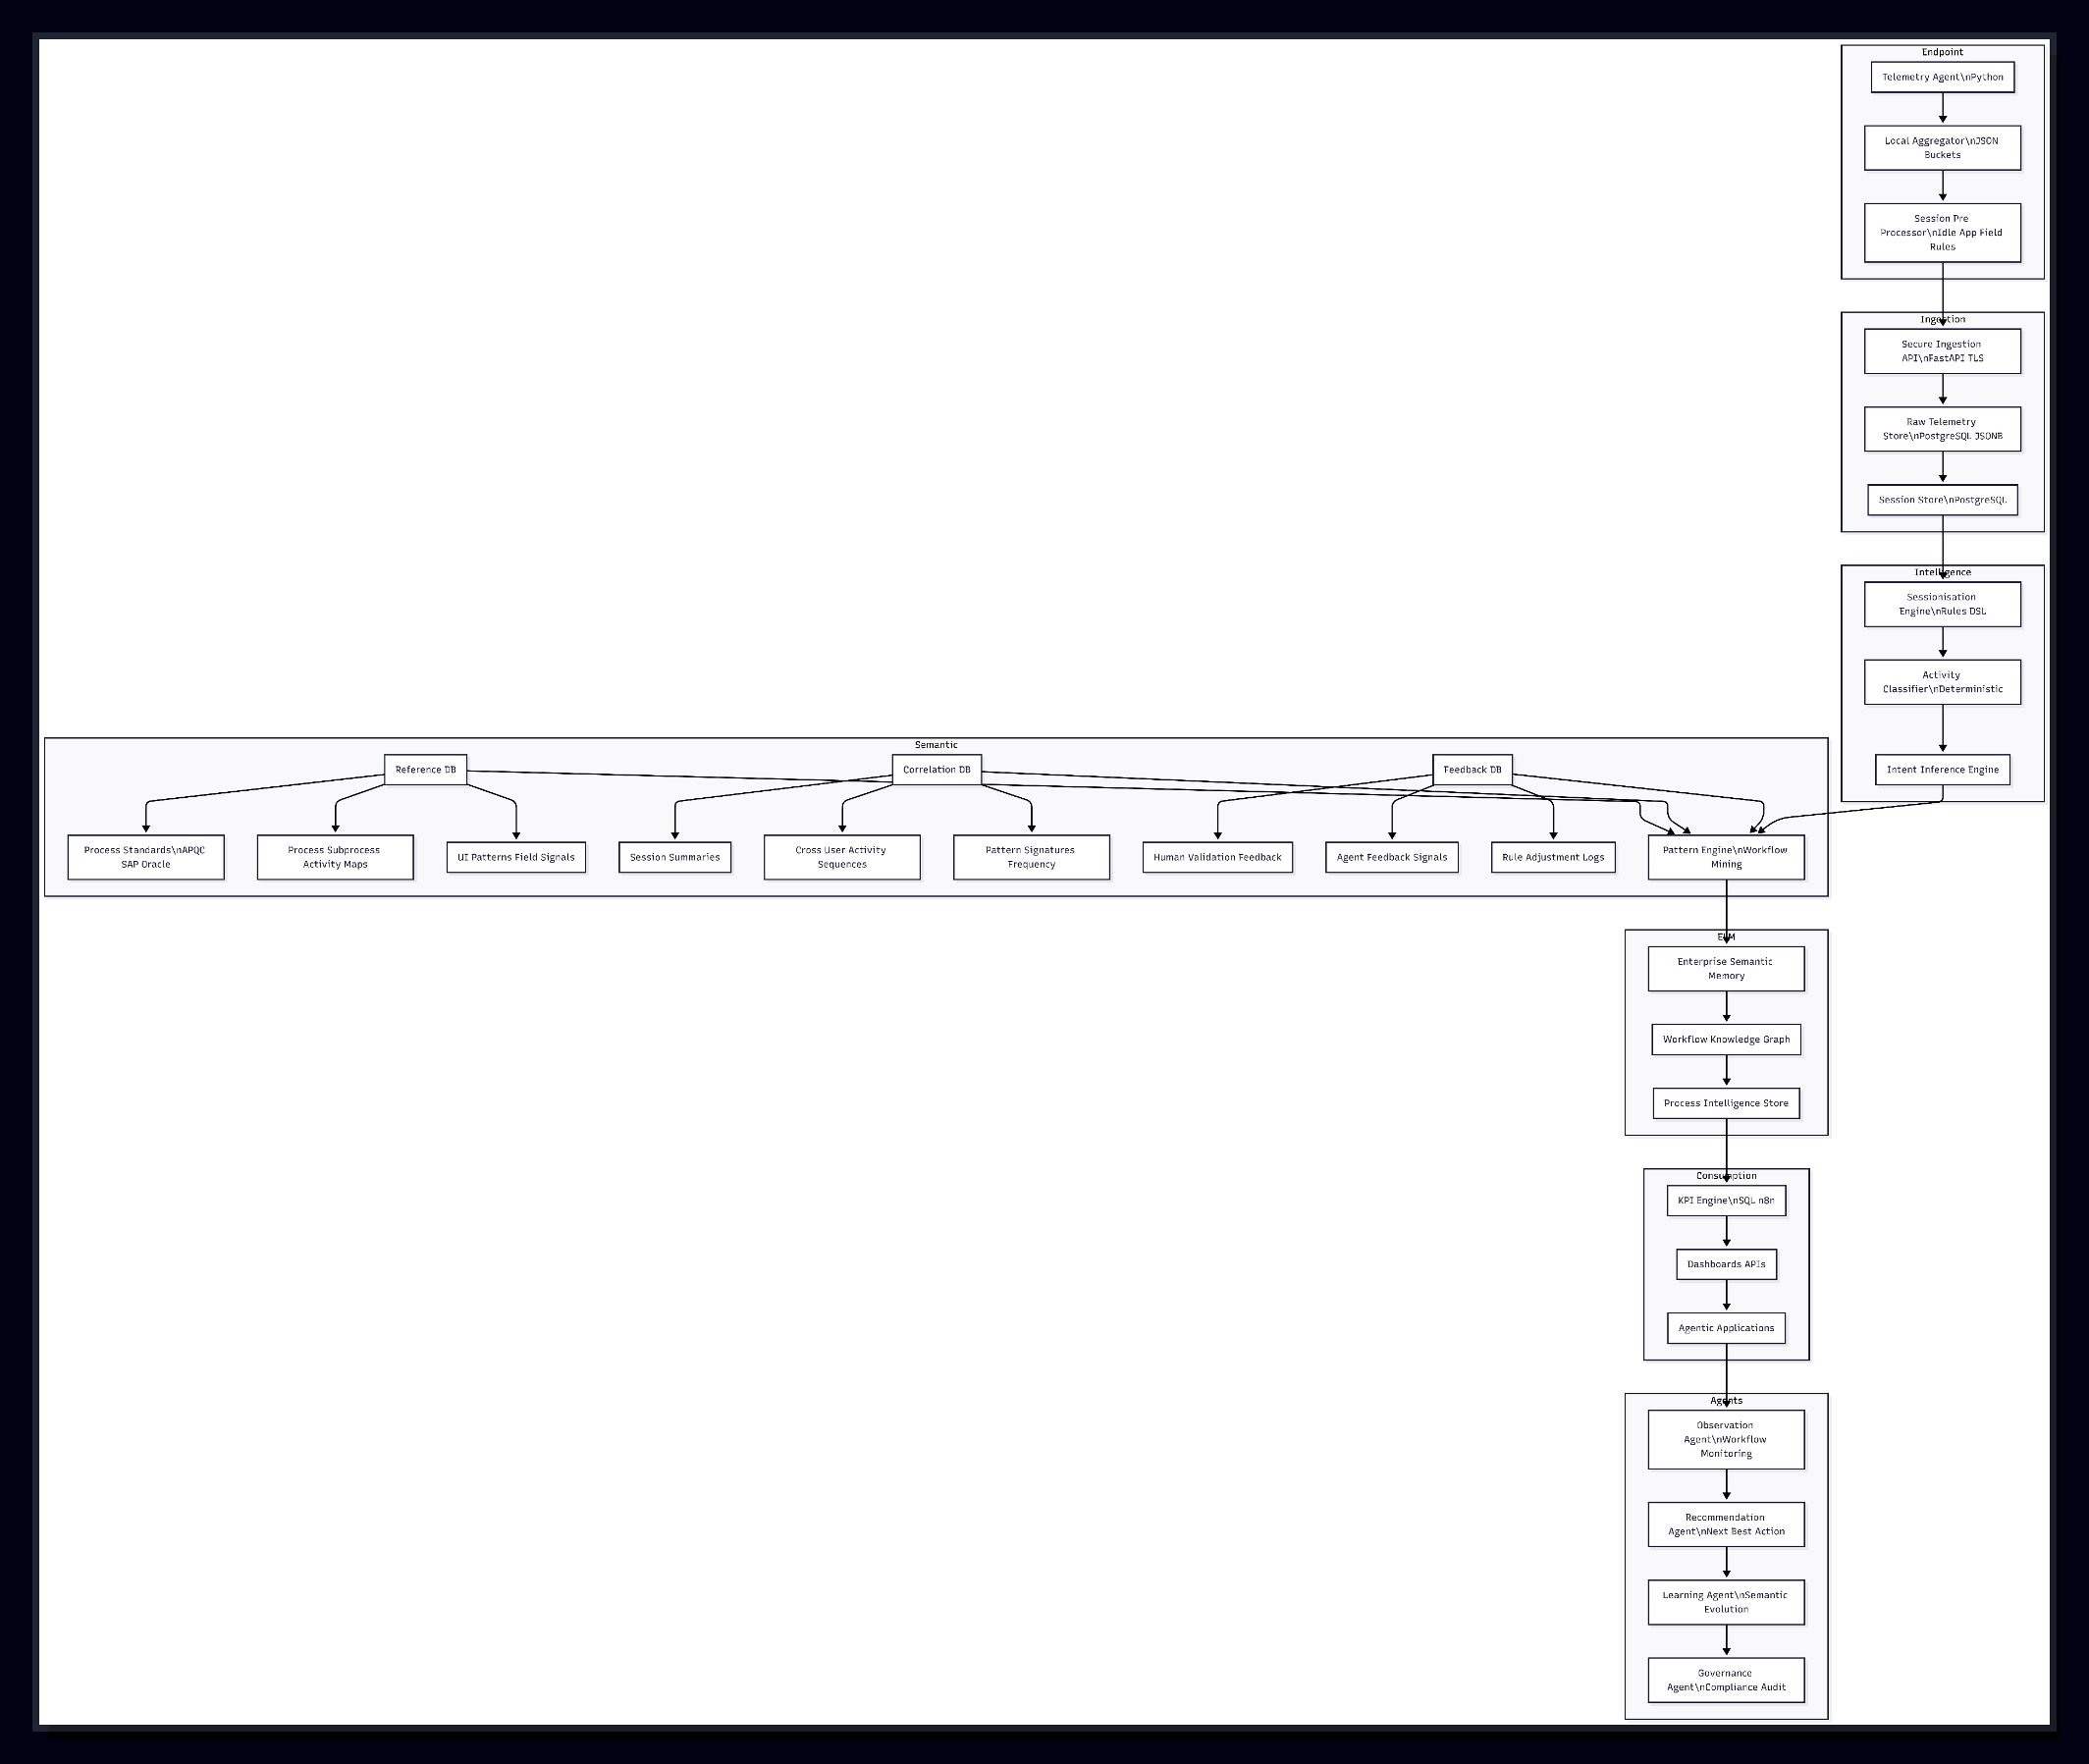
🧠How this diagram maps to the layered architectureEndpoint → Agents
- Endpoint: telemetry agent + local aggregation + session pre-processing.
- Ingestion: secure ingestion API + raw/session stores.
- Intelligence: sessionisation engine, activity classifier, intent inference.
- Semantic: reference/correlation/feedback DBs, workflow mining.
- Enterprise Memory: enterprise semantic memory, knowledge graph, process intelligence store.
- Consumption: KPI engine, dashboards/APIs, agentic applications.